Cortext Epic Epoch
Context
- Epic Epoch is a simple script for tracking dramatic changes in the composition of a field over time. It acts in three steps:
- First, the N most frequently occurring entities are selected at each time period
- A frequency timeline is built for each of the selected terms
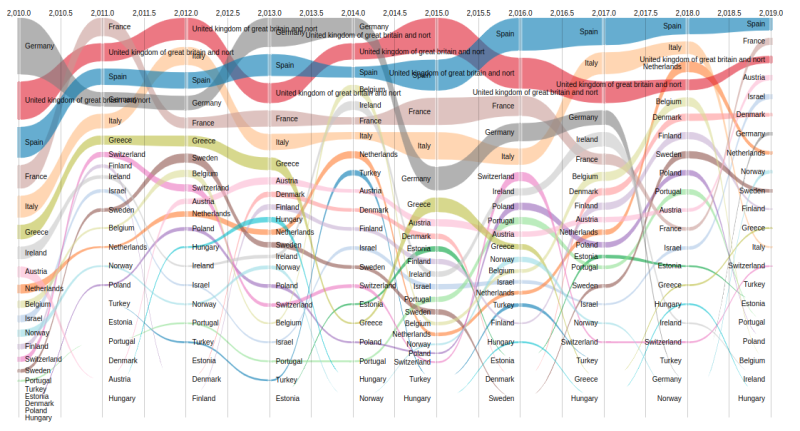
- A bump graph shows the evolution of frequency and ranking through time
Steps
-
Upon logging in, start a new project and proceed to import the "Cortext Epic Epoch" scenario. Next, configure the scenario by filling in the necessary inputs:
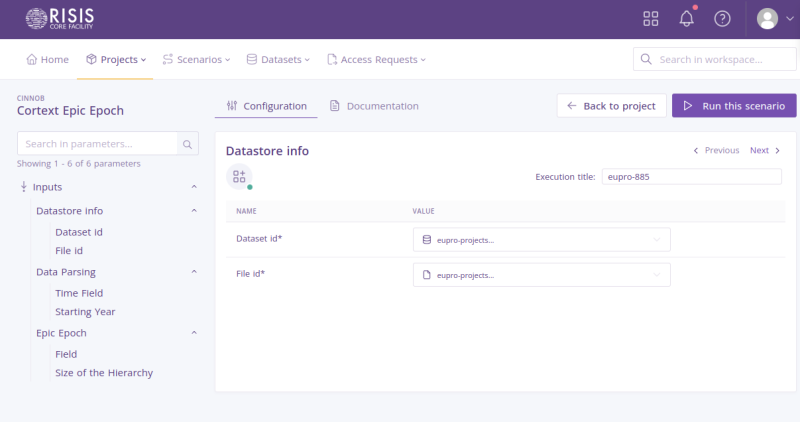
- Dataset id: Select a dataset that you have previously uploaded in this project.
- File id: Select a file from the dataset you have seleted in the previous field.
- Execution title: Enter an execution title to categorize each scenario configuration execution. This field is optional.
-
When all the required fields are filled, you can click on the button in the top right ‘Run this scenario’.
-
After the scenario execution is finished, check in the Outputs of the project for the new files produced (a bumpy graph and a csv file).
-
This bump graph has been generated using Cortex Manager's "Epic Epoch" script, which offers a comprehensive suite of temporal analysis tools. With the "Epic Epoch" script, users can seamlessly navigate and visualize time-series data, identifying critical inflection points, tracking long-term trends, and uncovering time-based insights that drive informed decision-making.
- Note: Clicking on any of the white rectangle dividers within a word’s journey will highlight it’s entire dynamics.